

01 · The caseTwo identical units, twenty floors apart
The one variable a floor plan cannot show you.
Two units in the same block. Same layout, same facing, same lease, same maintenance fee. One is on the fourth floor, one on the twenty-eighth. Every agent in Singapore will tell you the higher one is worth more. Almost none can tell you how much more — or that the answer changes completely depending on which part of the island you are standing in.
In the suburbs that climb is worth 34.1% on price per square foot. In prime it is worth 4.3% — close enough to nothing that it should change how you shortlist.
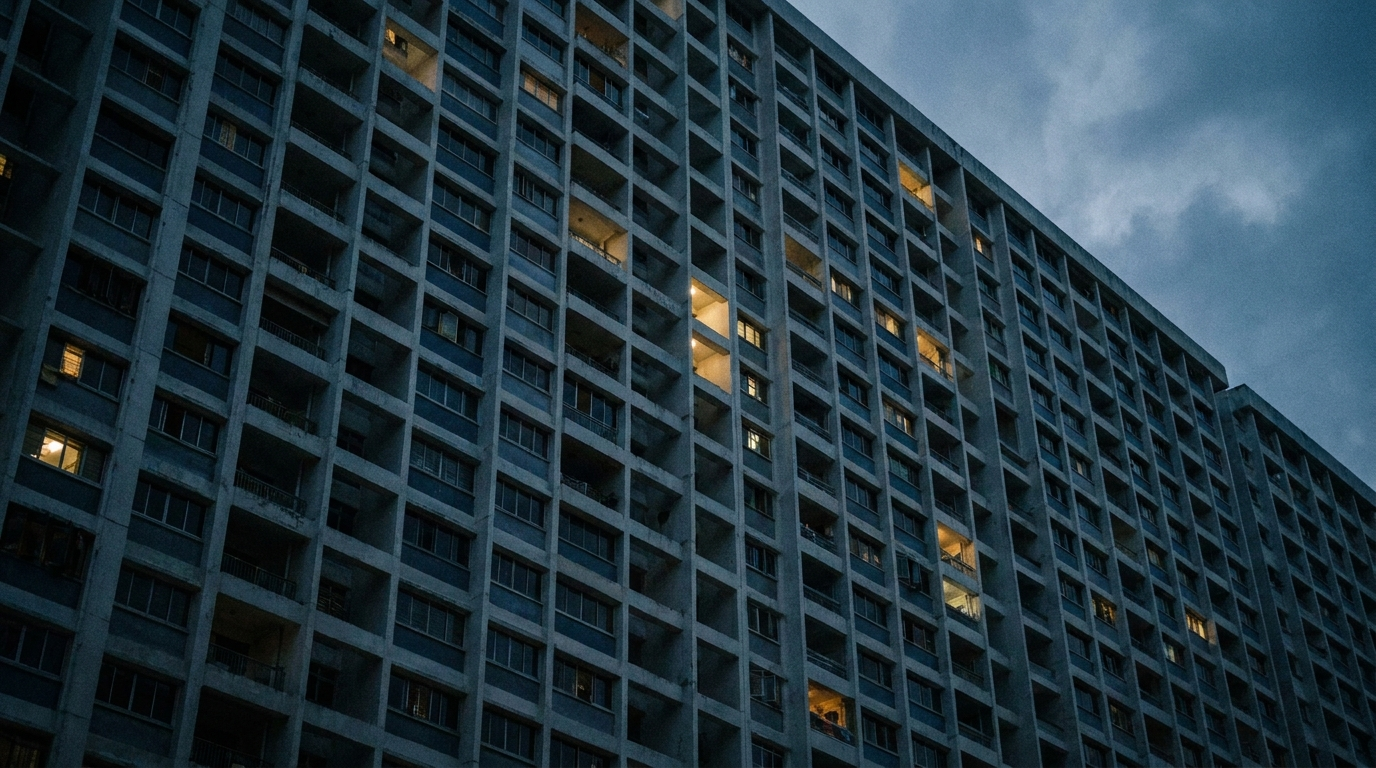
The same stack, twenty floors apart: the single biggest price variable a floor plan will never show you.
The same twenty-floor climb is worth 34.1% in the suburbs and 4.3% in prime.
02 · The claimHeight is priced by scarcity, not by altitude
What we assert, and what would disprove it.
The claim is simple: buyers pay for what a high floor delivers — an unobstructed outlook — and they pay in proportion to how rare that outlook is locally. Where towers are few and the surroundings low, height buys a genuine view. Where every neighbour is also forty storeys, it buys a different set of windows.
03 · MethodHow we measured this
Bands, thresholds, and the limits of a caveat record.
- The dataset. URA caveats, 2021-07 to 2026-07, private non-landed resale, Executive Condominiums excluded.
- Floor bands. Caveats report a five-storey band, not an exact floor. We group into four: low (01–10), mid (11–20), high (21–30) and very high (31+).
- Size bands. Under 600 sq ft, 600–900, 900–1,300 and 1,300+.
- The threshold. Every band reported carries at least 40 transactions.
- What we cannot see. Whether a specific unit actually has a view. A high floor facing another block is in our high-floor group; the market prices it lower, which makes our premium a conservative estimate.
Five-storey bands, 40-transaction minimums, and one honest blind spot: the data knows the floor, not the outlook.
04 · The evidenceThe premium, segment by segment
The same climb, three markets.
Read the three panels on a shared scale and the story is immediate. The suburban and fringe curves climb steadily. The prime curve is nearly flat — the market barely distinguishes a fourth-floor unit from a thirtieth-floor one on a per-square-foot basis.
By district the same pattern repeats: the strongest floor premiums sit in districts with low-rise surroundings, the weakest in dense high-rise clusters.
Suburbs 34.1%, fringe 30.0%, prime 4.3%. Height is paid for where the view is scarce.
05 · The mechanismWhy prime pays nothing for altitude
Scarcity, substitution, and what the buyer is really purchasing.
Three forces explain the flat prime curve.
- Substitution. In a district of towers, the next building over also offers a high floor. Abundant supply of a feature collapses its price.
- What prime buyers optimise for. Address, finish, layout and land. A view is expected rather than paid for — it is table stakes, not an upgrade.
- Obstruction risk cuts both ways. In dense prime districts a high floor can still face a wall, so buyers discount the whole category rather than trusting the floor number.
In the suburbs the logic inverts entirely. A tower among low-rise blocks offers something genuinely scarce — an outlook nobody can build out easily — and buyers pay 34.1% for it.
Weighing up two floors in the same stack? WhatsApp us the project — we’ll price the gap from its own transactions →06 · The second premiumThe shoebox tax
The price you pay per square foot for buying fewer of them.
Height is not the only invisible premium. Small units cost more per square foot than large ones — and like height, the effect is a suburban phenomenon.
In the suburbs, sub-600 sq ft units trade 25.9% above the 1,300+ band on a psf basis. On the fringe it is 9.0%. In prime it is -0.2% — effectively nothing.
The mechanism is quota, not quality: a smaller absolute price opens a unit to a much larger pool of buyers and investors, and that competition shows up in psf. It matters most when you sell, because you inherit the same maths in reverse.
Suburban shoeboxes carry a 25.9% psf premium. In prime the size premium is -0.2% — another scarcity effect, not a quality one.
07 · The counter-caseWhere the premium misleads
Three ways this analysis could lead you astray.
The honest caveats matter more here than in most of our work, because floor and size premiums are easy to over-apply.
- Our bands are coarse. A five-storey band cannot separate floor 21 from floor 25. Within-band variation is invisible to us and very visible to a buyer standing at the window.
- The data cannot see the view. A high floor facing a wall sits in our high-floor group and drags the measured premium down. The true premium for a genuinely unobstructed unit is higher than we report.
- Psf is not price. A shoebox with a 25.9% psf premium is still the cheaper cheque. Confusing the two is the most common error we see in buyer spreadsheets.
Coarse bands and blind-to-view data make these figures conservative floors, not ceilings — and psf is never the same thing as price.
08 · Your moveWhat this means for you
Four situations, four numeric rules.
If you are choosing a floor in a suburban project
The premium is real and large. Decide deliberately whether the outlook is worth roughly a third more per square foot — and remember you will be selling into the same premium later.
In OCR, budget about 34.1% psf for the climb from low to high floor. It comes back on exit.
If you are buying in prime
Do not pay a large premium for altitude. The market barely rewards it, so the money is better spent on the layout, the stack or the address.
In CCR the floor premium is 4.3%. Paying materially more than that for height is paying for something the resale market will not repay.
If you are buying small
Enter with your eyes open: you pay the psf premium going in, and you rely on the same buyer pool existing when you exit.
A suburban shoebox costs about 25.9% more per square foot. Ask who buys it from you, and at what price.
If you are selling
Your floor and size band place you inside your project’s distribution. Price to that, not to the project’s headline median.
Price against your own band. A low-floor unit marketed at the project median will sit unsold.
Which floor are you weighing up?
We’ll price the floor gap using the project’s own transactions.
- The psf premium by floor band in your project
- How your stack sits inside its distribution
- The size-band effect on your exit
One WhatsApp message back — usually same day.
We’ll WhatsApp it shortly — usually within the day.
09 · The recordFloor premium by district
Low band against high band, everywhere we can measure it.
10 · MethodSources, limits and corrections
Data: URA caveats, 2021-07 to 2026-07, private non-landed resale, Executive Condominiums excluded.
Bands: floors grouped from the five-storey bands reported in caveats; sizes into four bands by square feet.
Thresholds: minimum 40 transactions per reported band; 17 districts qualified for the floor comparison.
Known limits: caveats record a floor band, never an outlook — units with obstructed views sit in the high-floor group and make these premiums conservative.
Reproducibility: produced by flagships.py. Corrections in place, dated.
Not investment advice.
Your floor is not your project.
Two units in one block can sit a third apart on price per square foot. The Scenario Planner works from your actual unit, not the project average.
Map my move →