

01 · The questionWhat are you actually paying for?
The received wisdom, and the number usually attached to it.
Freehold holds its value; leasehold decays. It is the most repeated rule in Singapore property, and it carries a number: pay a premium now, recover it later, because land you own forever must beat land you rent for ninety-nine years.
The premium is real and we can measure it precisely. Across our window, freehold resales cleared at a median of S$1,731 psf against S$1,524 for 99-year leasehold — a gap of 13.6%.
Then we broke it down by district, and the rule stopped behaving like a rule.
Freehold carries a 13.6% island-wide premium. That single number is the least useful fact in this article.
02 · The claimThe premium is mostly location wearing a tenure costume
Narrow enough to be falsified.
We are not claiming tenure is worthless, or that a 99-year lease will not decay — it will, and the last decades are brutal. We are claiming that at today’s prices, in most of Singapore, the tenure label is not what sets the price. Where the building is, how old it is, and what sits around it matter more.
Notice the distance between the first and third figures. The island-wide premium is pulled upward by a handful of districts; the typical district looks very different.
03 · MethodHow we measured this
Including the exclusion that changes the answer.
- The dataset. URA caveats, 2021-07 to 2026-07, private non-landed resale only, Executive Condominiums excluded.
- The 999-year trap. 2,204 transactions sit on 999-year leases. They are functionally freehold; counting them as “leasehold” would quietly inflate the leasehold median and shrink the premium. They are excluded from both sides.
- The threshold. A district appears only with at least 40 transactions of each tenure — 22 districts qualify.
- What we did not do. We did not adjust for building age, which is the largest confounder here and the subject of section 05. We show it rather than model it away.
Public caveats, 999-year leases excluded by name, and the main confounder disclosed rather than hidden in a model.
04 · The evidenceThe premium, district by district
The island-wide average against the districts that make it up.
Each row is one district: grey dot the leasehold median, navy dot the freehold median.
At the top, D26 shows a freehold premium of 34.0%. At the bottom, D14 runs at -17.8% — leasehold priced above freehold, in the same district, over the same five years.
An island-wide number that averages a 34.0% premium with a -17.8% discount is not describing a market. It is describing two different markets that happen to share a country.
The premium ranges from 34.0% to -17.8% across districts. A single national figure conceals the entire decision.
05 · The mechanismWhy the premium varies so much
Three forces, none of which is the lease itself.
By segment the premium runs 10.4% in prime, -7.8% on the city fringe and 7.0% in the suburbs. Three forces drive the spread.
- Age, not tenure. Freehold stock skews older. Much of what the “freehold premium” measures in one district is simply a newer leasehold building beating a tired freehold one.
- Where the new land goes. Government land sales are leasehold, and they land near new rail and new schools. The best-located new stock in Singapore is structurally 99-year.
- Who the buyer is. Owner-occupiers buy the home and the commute. Legacy buyers buy the land. Districts thick with the first type price tenure closer to irrelevant.
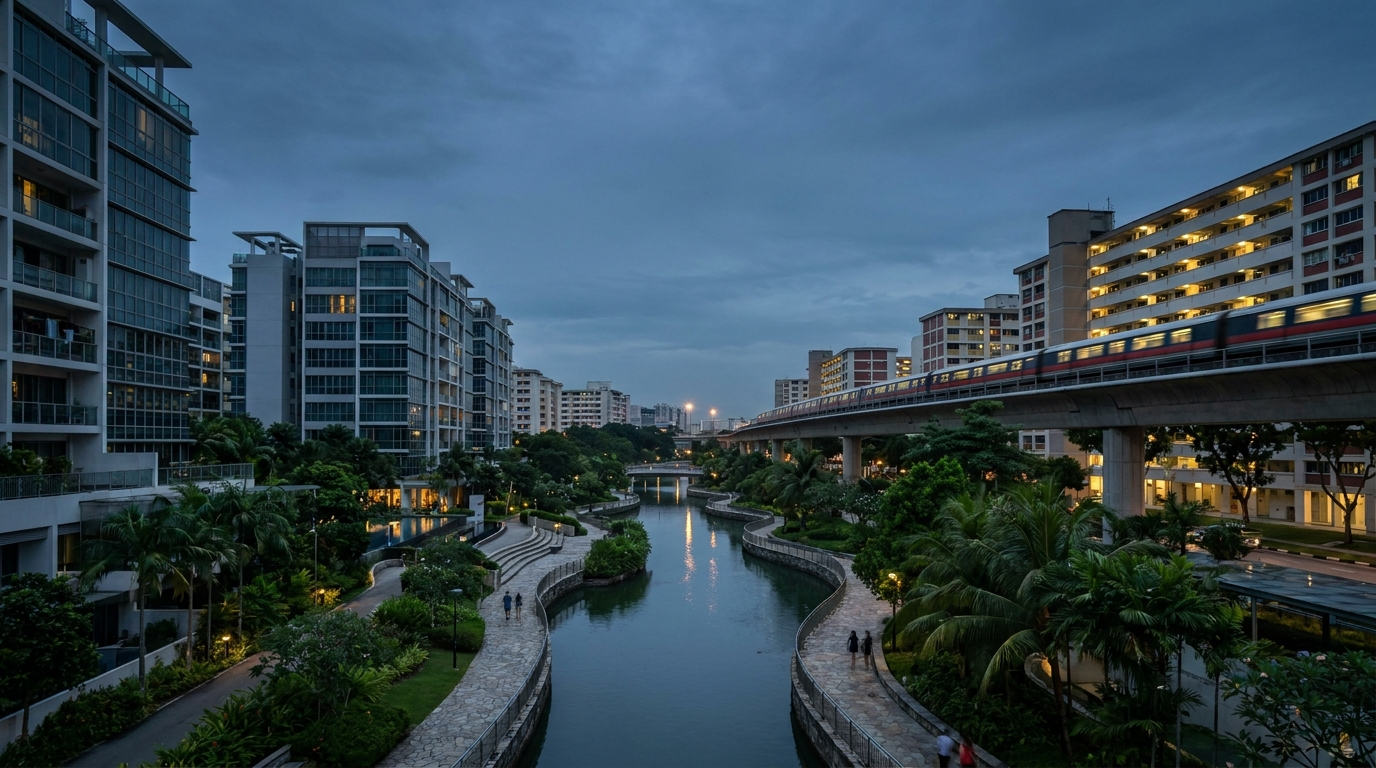
New land released in Singapore is leasehold — so the newest, best-connected stock is structurally 99-year.
06 · The cohortThe districts where leasehold wins
Named districts, real numbers, in both directions.
The extremes are where the argument lives. D26 pays 34.0% for freehold: older leasehold stock, land-led buyers, scarce freehold plots. D14 runs at -17.8%: newer leasehold projects, better sited, and a buyer base that is choosing a home rather than an estate.
The practical consequence is that “buy freehold” is not portable advice. In roughly half the districts we can measure, following it would have meant paying more for the weaker-performing asset.
D26 pays 34.0% for freehold; D14 pays -17.8%. The advice inverts depending on where you stand.
07 · The counter-caseWhat this analysis cannot tell you
The strongest argument for freehold, stated fairly.
Here is the honest limit of everything above: our window is five years long, and lease decay is a fifty-year phenomenon.
A 99-year lease with eighty years remaining behaves like freehold for pricing purposes. The same lease at forty years behaves nothing like it — financing tightens, CPF usage restricts, the buyer pool narrows. Our data covers a period in which most leasehold stock was young. It cannot see the far end of the curve, and we will not pretend otherwise.
So the fair conclusion is bounded: at the tenure ages transacting today, in most districts, the freehold premium is not what buyers assume. That is a statement about the present price of tenure, not a prediction that a forty-year lease will hold up.
Five years of data cannot measure fifty years of decay. The finding is about today’s prices, not the end of the lease.
08 · Your moveWhat this means for you
Four situations, four numeric rules.
If you own freehold
Your premium is district-specific, not national. Before pricing on the assumption that freehold commands more, check what the leasehold stock in your own district actually clears at.
Price against your district’s tenure split, not the island’s. The range runs from -17.8% to 34.0%.
If you are choosing between two units
Compare like ages. A ten-year-old leasehold against a thirty-year-old freehold is an age comparison wearing a tenure label.
Hold age constant before you compare tenure. If you cannot, you are measuring the building, not the lease.
If you are buying for the long hold
The decay curve is real even though our window cannot see it. If your horizon is genuinely multi-decade, tenure matters more than this five-year comparison suggests.
Horizon over 25 years: weight tenure heavily. Under 10: weight location and age heavily.
If you are buying to rent out
Tenants pay for location, condition and commute. They do not pay for your lease. Yield logic tends to favour the better-located leasehold unit.
For yield, buy the commute, not the lease. Tenants never pay a tenure premium.
What does tenure cost in your district?
We’ll run the freehold-versus-leasehold split where you’re actually buying.
- Freehold vs 99-year medians for your district
- How the gap changes once age is held constant
- The named projects on both sides
One WhatsApp message back — usually same day.
We’ll WhatsApp it shortly — usually within the day.
09 · The recordEvery measurable district
The full table behind the charts.
Median psf by tenure for each district, with the premium between them. Negative means leasehold priced higher.
10 · MethodSources, limits and corrections
Data: URA caveats, 2021-07 to 2026-07, private non-landed resale, Executive Condominiums excluded.
Exclusion: 2,204 transactions on 999-year leases removed from both sides — functionally freehold.
Thresholds: minimum 40 transactions of each tenure per district; 22 districts qualified.
Known limits: building age is the dominant confounder and is disclosed rather than modelled away; a five-year window cannot observe late-stage lease decay.
Reproducibility: produced by flagships.py. Corrections made in place and dated.
Not investment advice.
Tenure is a district question.
The premium runs from -17.8% to 34.0% depending where you stand. The Scenario Planner puts your own numbers against the market you’re actually buying into.
Map my move →